Conversational AI Statistics 2026
Market size estimates, developer adoption, model downloads, hiring and search demand - measured, sourced, and refreshed monthly.
Ethora Research · Last updated 2026-09-02 · Data snapshot: August 2026 · CC BY 4.0 - free to reuse with attribution
Most conversational AI statistics circulating online are copies of copies. This page is different: the majority of the numbers below are primary measurements taken for The State of Conversational AI, Q3 2026 (Ethora Research) - GitHub stars, package downloads, Hugging Face pulls, search demand, open-job counts and LinkedIn talent counts - each linking to its full dataset. Market-size figures come from the named analyst houses. Data snapshot: August 2026; page reviewed monthly.
Key statistics
- US search volume for "ai agents" grew from about 60 searches a month in early 2023 to roughly 50,000 a month in 2026 - about a 700-fold rise. Source: Search demand dataset
- 24 of 28 tracked conversational-AI buying terms now trigger a Google AI Overview. Source: Search demand dataset
- LiteLLM, a multi-provider model router, is downloaded about 744 million times a month on PyPI - multi-provider abstraction is now default plumbing. Source: SDK downloads dataset
- The Model Context Protocol (MCP) went from launch (late 2024) to 339 million monthly PyPI downloads and ~90,000 GitHub stars on its servers repository in under two years. Source: SDK downloads / GitHub adoption
- Ollama is the most-starred conversational-AI project measured: 178,535 GitHub stars (Aug 2026), ahead of Langflow (153,239) and Dify (152,436). Source: GitHub adoption dataset
- Open-weight model families led by downloads: Qwen (112.8M) and Gemma (97.1M) 30-day Hugging Face downloads; by likes, DeepSeek leads (33,128). Source: Open-weight LLM dataset
- The United States has on the order of 300,000 open AI/LLM roles - and only ~112,000 LinkedIn-visible core AI/ML engineers: about 2.7 open roles per practitioner. Source: Jobs demand dataset
- Singapore leads both concentration tables: ~1,134 open AI roles and ~876 AI/ML engineers per million people. Source: Talent dataset
- "AI agent" is already a top-three US hiring category at roughly 61,000 open roles, alongside generative AI (~81k) and AI engineer (~61k). Source: Jobs demand dataset
- Analyst estimates put the conversational-AI market at roughly $13-18 billion in 2025-2026, with forecasts of $41-82 billion by 2030-2034 (details and sources below). Source: Market size estimates
Market size estimates
No two analyst houses define the conversational-AI market the same way, so estimates vary widely - we report them side by side rather than picking one. The consensus shape: a market in the low-to-mid tens of billions today, growing at roughly 20-26% a year.
| Analyst house | Base estimate | Forecast | CAGR |
|---|---|---|---|
| Grand View Research | $14.29B (2025) | $41.39B by 2030 | 23.7% |
| MarketsandMarkets | $17.05B (2025) | $49.80B by 2031 | 19.6% |
| Fortune Business Insights | $17.97B (2026) | $82.46B by 2034 | 21.0% |
| Research and Markets | $17.12B (2026) | - | 25.6% |
Conversational AI market size estimates by analyst house (retrieved September 2026).
Developer adoption: GitHub and package downloads
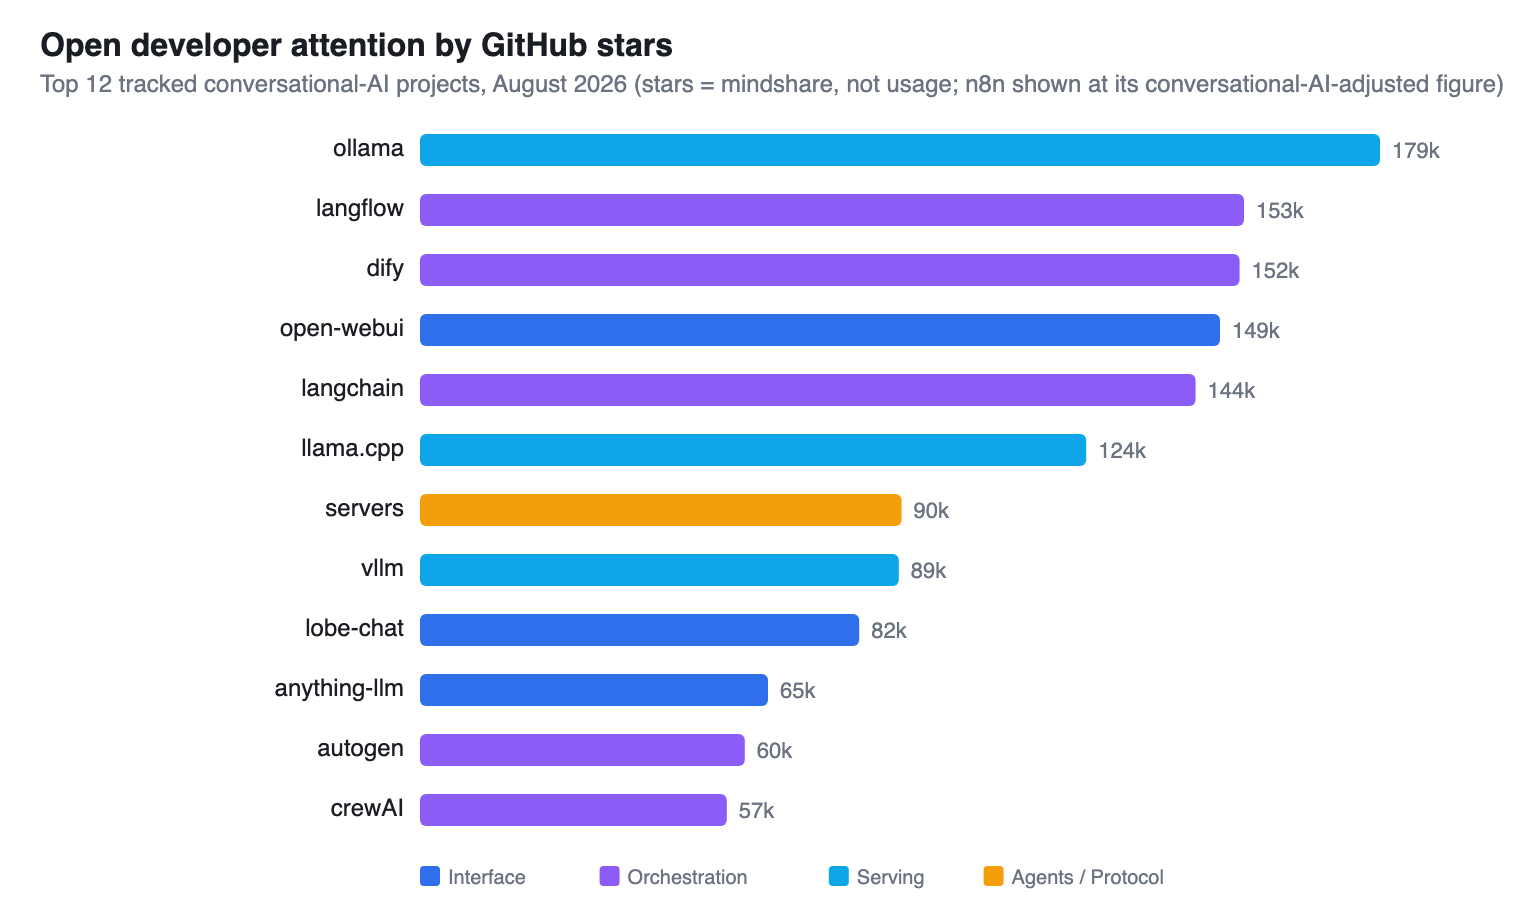
Figure. Open developer attention by GitHub stars, top tracked conversational-AI projects (Aug 2026).
Open developer attention concentrates at the two ends of the stack: running models on your own infrastructure (Ollama, llama.cpp, vLLM) and wiring them together (orchestration frameworks and the new protocol layer). Stars measure developer mindshare, not production usage - install counts below sharpen the picture.
| Project | Layer | GitHub stars |
|---|---|---|
| ollama/ollama | Serving | 178,535 |
| langflow-ai/langflow | Orchestration | 153,239 |
| langgenius/dify | Orchestration | 152,436 |
| open-webui/open-webui | Interface | 148,767 |
| langchain-ai/langchain | Orchestration | 144,246 |
| ggml-org/llama.cpp | Serving | 123,903 |
| modelcontextprotocol/servers | Agents / Protocol | 89,561 |
| vllm-project/vllm | Serving | 89,044 |
| lobehub/lobe-chat | Interface | 81,690 |
| Mintplex-Labs/anything-llm | Interface | 64,705 |
Most-starred conversational-AI projects, Aug 2026. Full 34-project dataset: github-adoption-2026-08.
Monthly package downloads (Aug 2026): LiteLLM ~744M (PyPI), openai ~432M (PyPI), mcp ~339M (PyPI), langchain ~279M (PyPI), @modelcontextprotocol/sdk ~198M (npm), @anthropic-ai/sdk ~117M (npm). Full table: SDK downloads dataset.
Open-weight models: what people run vs what people love
By 30-day Hugging Face downloads, Qwen (112.8M) and Gemma (97.1M) lead, ahead of Llama (29.0M), DeepSeek (19.4M) and Phi (18.8M). By likes - a mindshare signal - the order flips: DeepSeek (33,128), Llama (27,319), Kimi (20,133) and Mistral (18,762) lead while Qwen sits far lower. There are two different "leading" open models depending on whether you measure what people run or what people love. Full table: open-weight LLM dataset.
Licensing matters: Cohere's Command family is non-commercial, Mistral's newest flagships are research-only unless licensed, and Llama and Gemma carry custom terms with real restrictions. Details: licence dataset.
Search demand: agents became the story
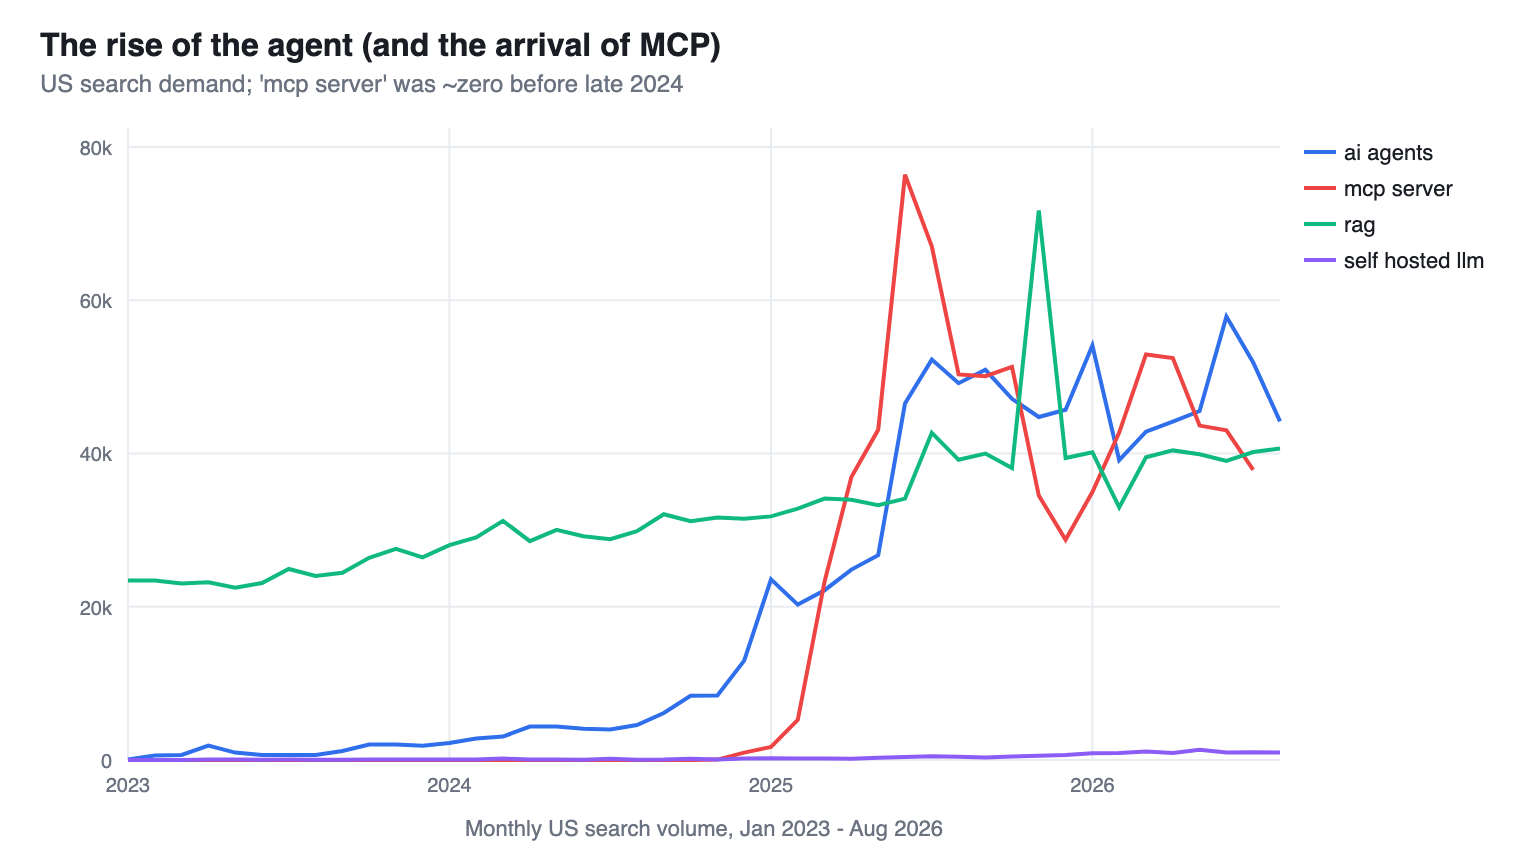
Figure. Three-year US search-volume trend for headline category terms. Volumes are third-party estimates.
US search for "ai agents" rose roughly 700-fold since early 2023 (about 60 to ~50,000 monthly searches) and now leads the category's vocabulary. "mcp server" had effectively zero volume before late 2024 and reached tens of thousands of monthly searches within about eighteen months. "rag" doubled and then plateaued into assumed infrastructure, and "self hosted llm" climbs steadily. 24 of the 28 tracked buying terms trigger a Google AI Overview. Full 28-term dataset with 3-year trends: search demand dataset.
Jobs and talent by country
The demand side (open AI/LLM roles, Aug 2026): the United States leads at ~301,000 open roles (~900 per million people); India ~36,000; United Kingdom ~18,000; Canada ~12,000. Per capita, Singapore leads at ~1,134 open AI roles per million. The supply side (LinkedIn-visible core AI/ML engineers): US ~112,000 and India ~95,000 dominate absolute supply, while per capita Singapore (~876/million) leads again, ahead of the UAE (410), Switzerland (407) and Ireland (348).
| Country | Open AI/LLM roles | Per million people |
|---|---|---|
| United States | ~301,000 | 900 |
| India | ~36,000 | 25 |
| United Kingdom | ~18,000 | 266 |
| Canada | ~12,000 | 301 |
| Germany | ~8,600 | 103 |
| Singapore | ~6,800 | 1,134 |
| Australia | ~4,700 | 182 |
| France | ~3,600 | 53 |
| Netherlands | ~1,650 | 92 |
Open AI/LLM roles by country, Aug 2026. Keyword counts overlap, so totals are directional. Full matrix: jobs demand dataset.
Setting demand against supply: the US runs about 2.7 open roles per core practitioner (a talent importer), Singapore 1.3 and the UK 1.1; India (0.4), France (0.3) and the Netherlands (0.3) are net talent exporters. Talent detail: talent dataset.
The freelance market is barbelled
On Freelancer.com, AI projects are overwhelmingly small and fixed-price: a median advertised budget around $250 (hourly work ~$14/hr), dominated by chatbot-integration and automation gigs. On Upwork, across ~100 open AI chatbot and LLM listings (Aug 2026), over 95% of postings are hourly at a median ~$30/hour (middle half $24-$40), skewing Expert and Intermediate. Serious conversational-AI capability is hired in-house or on skilled contracts; low-end implementation has commoditised into offshore piecework. Full data: freelance market dataset.
Frequently asked questions
- How big is the conversational AI market in 2026?
- Analyst estimates vary by definition: roughly $13-18 billion for 2025-2026 (Grand View Research $14.29B for 2025; MarketsandMarkets $17.05B for 2025; Fortune Business Insights $17.97B for 2026), with forecasts of $41-82 billion by 2030-2034 at a 20-26% CAGR.
- What is the most popular open-source conversational AI project?
- By GitHub stars (Aug 2026), Ollama leads with 178,535 stars, followed by Langflow (153,239), Dify (152,436), Open WebUI (148,767) and LangChain (144,246).
- How fast is interest in AI agents growing?
- US search volume for "ai agents" grew from about 60 searches a month in early 2023 to roughly 50,000 a month in 2026 - about a 700-fold rise - and "AI agent" is already a top-three US AI hiring category at roughly 61,000 open roles.
- Which country has the most AI jobs?
- The United States, with on the order of 300,000 open AI/LLM roles in August 2026. Per capita, Singapore leads with about 1,134 open AI roles per million people.
Ethora Research. (2026). Conversational AI Statistics 2026: Market Size, Adoption, Jobs and Search Demand. Retrieved from https://ethora.com/research/statistics/conversational-ai-statistics/
Most figures come from The State of Conversational AI, Q3 2026 (DOI: 10.5281/zenodo.22131590), released under CC BY 4.0 with open data and collection scripts at github.com/dappros/state-of-conversational-ai. Every statistic above links to its dataset or named external source. Methodology: measurement notes.Numbers are point-in-time snapshots and interest proxies, not revenue or market share: stars and downloads measure developer attention and pulls, search volumes are third-party estimates, and job/talent counts are keyword- and LinkedIn-based with stated limits. See the methodology page for each metric's caveats.